
To enable Synthetics Monitoring in New Relic, go to one.newrelic.com > Synthetic monitoring > Create monitor. Select monitor type, name, and monitoring frequency.
Synthetic monitoring simulates user interactions to evaluate system performance and behavior. By following these steps, you can effectively set up and utilize Synthetics Monitoring in New Relic to enhance your system’s performance and reliability. Proper configuration and utilization of Synthetics Monitoring can provide valuable insights into your system’s behavior and performance, allowing you to proactively address any issues and optimize user experience.
Make sure to create and customize monitors based on your specific monitoring needs and objectives to maximize the benefits of Synthetics Monitoring in New Relic.
Credit: newrelic.com
Contents
Enabling Synthetic Monitoring
To get the most out of New Relic’s powerful synthetic monitoring feature, you need to know how to enable it correctly. Synthetic monitoring allows you to simulate user interactions and gather valuable data on how your system behaves.
How To Enable Synthetic Monitoring In New Relic
If you’re ready to start using synthetic monitoring in New Relic, follow these simple steps:
- Go to one.newrelic.com and navigate to the “Synthetic monitoring” section.
- Click on “Create monitor” to begin configuring your monitors.
- Specify the monitor type and give it a name that accurately represents its purpose.
- Choose a period that determines how often each location will run your monitor. This will help you gather data at the desired frequency.
By following these steps, you will successfully enable synthetic monitoring in New Relic and start gathering valuable insights into your system’s performance.
How To Enable Browser Monitoring In New Relic
In addition to synthetic monitoring, New Relic also offers browser monitoring capabilities. To enable browser monitoring for your applications, follow these steps:
- Go to one.newrelic.com and click on “All capabilities”.
- Select “Browser” and choose the specific app for which you want to enable browser monitoring.
- Click on “Settings” and verify that browser monitoring has been enabled for that app.
- Follow the standard procedures for enabling browser settings for each of your applications.
By following these steps, you will ensure that browser monitoring is correctly enabled in New Relic for all your applications, allowing you to gather performance data conveniently.
Configuring And Creating Synthetics Monitors
Configuring and Creating Synthetics Monitors in New Relic is vital for monitoring the performance and availability of web applications. By setting up synthetic monitors, you can proactively detect and address potential issues before they impact your end-users. Here, we will delve into the essential steps of configuring and creating synthetics monitors in a new runtime, as well as explore the different types of monitors and their functionalities.
Configuring Synthetics Monitors In Our New Runtime
When configuring synthetics monitors in New Relic’s new runtime, it’s crucial to define the parameters that determine the monitoring scope. This includes selecting the monitor type, specifying the monitor name, and setting the frequency at which each location will execute the monitor.
Synthetics Monitor Types And What They Do
New Relic offers various types of synthetic monitors, each designed to fulfill specific monitoring needs. These include:
- Ping Monitor
- SSL Certificate Expiration Monitor
- Page Load Monitor
- User Flow Functionality Scripted Browser
- Scripted API Monitor
- User-Step Execution Monitor
- Synthetic Monitor Example
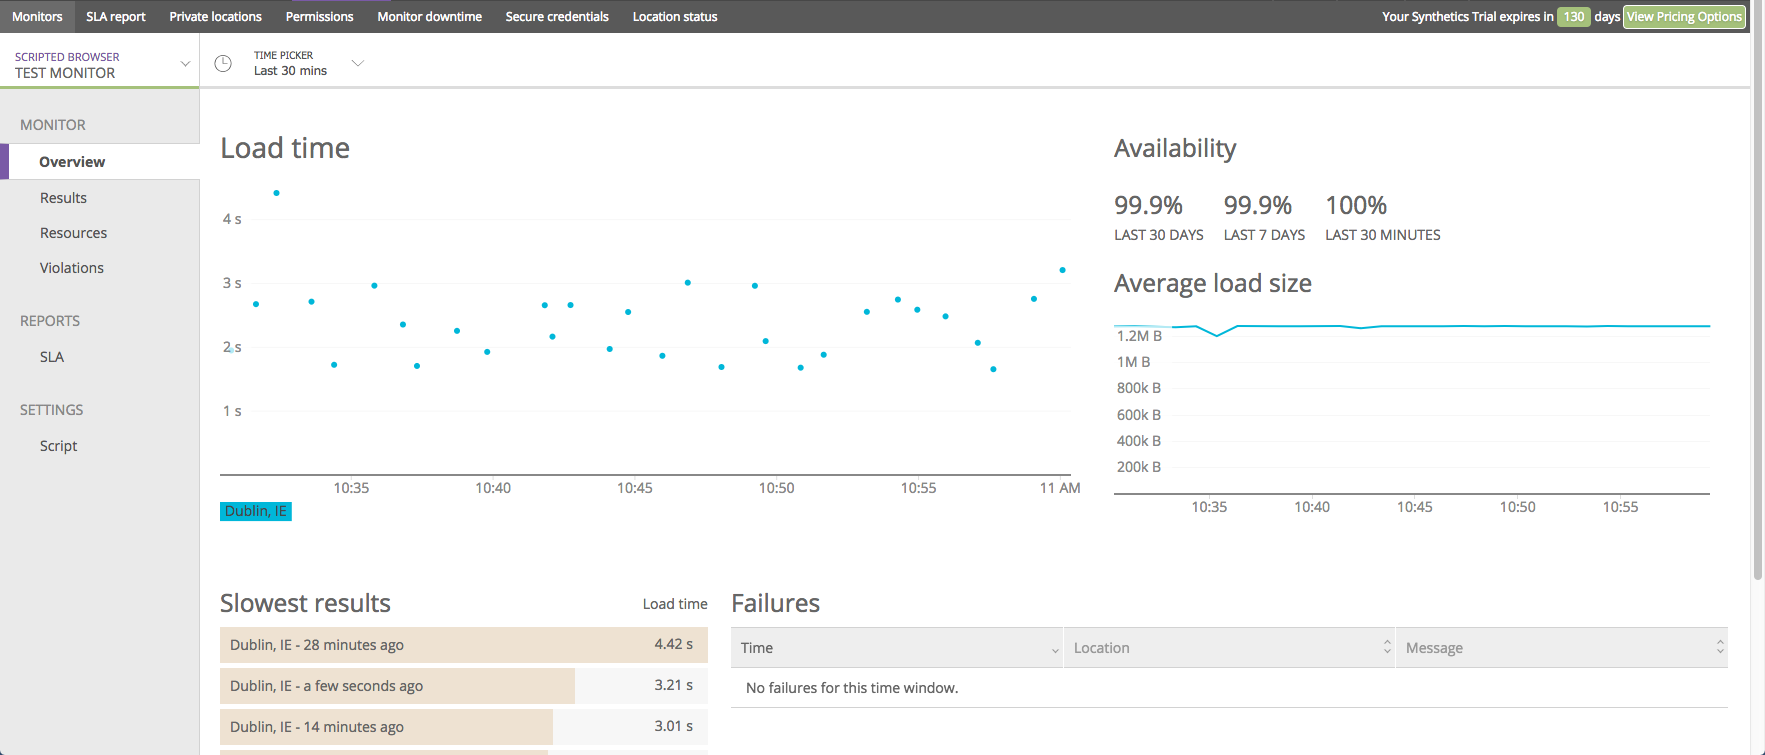
Analyzing And Troubleshooting Synthetics Results
Looking to troubleshoot and analyze synthetic results in New Relic? Learn how to get synthetics monitoring to work with step-by-step guidance on configuring monitors, monitor types, enabling synthetic monitoring, and understanding how it works. Harness the power of synthetic monitoring to optimize your system’s performance.
Availability and Functionality Monitoring with New Relic When setting up Synthetics monitoring in New Relic, it is crucial to monitor both the availability and functionality of your applications. New Relic’s Synthetics tool offers a comprehensive way to ensure that your applications are performing optimally at all times. Troubleshooting synthetic monitor installations Troubleshooting synthetic monitor installations
To Ensure That Your Synthetic Monitor Installations Are Working Effectively, Follow These Steps:
– validate Scripts: Make Sure That Your Scripts Are Correctly Configured And Free Of Errors.
– monitor Configuration: Double-check The Configuration Settings Of Your Monitors To Ensure They Are Set Up Correctly.
– runtime Monitoring: Keep Track Of The Runtime Performance Of Your Synthetic Monitors To Identify Any Issues Promptly.
– analyze Results: Regularly Analyze The Results Of Your Synthetic Monitors To Spot Any Anomalies Or Downtimes. by Consistently Analyzing And Troubleshooting Your Synthetics Results With New Relic, You Can Optimize The Performance Of Your Applications And Ensure A Seamless User Experience.
Credit: docs.newrelic.com
Managing Synthetics Monitors
Easily configure synthetics monitors in New Relic’s new runtime for effective monitoring. Learn how to enable synthetic monitoring, choose monitor types, create and troubleshoot monitors, and maximize availability and functionality.
How To Turn Off Synthetic Monitors In New Relic
To turn off a synthetic monitor in New Relic, simply access the account associated with the monitor request in the New Relic UI.
Best Practices For Managing Synthetics Monitors
When managing synthetics monitors in New Relic, it is essential to follow best practices to ensure efficient monitoring.
Consider the following tips:
- Regular Review: Periodically review your synthetic monitors to ensure they are relevant and functioning correctly.
- Custom Alerts: Set up custom alerts to be notified of any issues detected by your synthetic monitors.
- Data Retention: Define a data retention policy to manage the storage of monitor data efficiently.
By implementing these best practices, you can effectively manage your synthetics monitors and maximize the benefits of monitoring with New Relic.
Credit: newrelic.com
Conclusion
Mastering the setup of Synthetics Monitoring in New Relic is crucial for optimizing website and application performance. By understanding the different monitor types and enabling synthetic monitoring, businesses can proactively troubleshoot issues and ensure seamless user experiences. With these best practices, you can harness the full potential of New Relic Synthetics and elevate your digital operations.